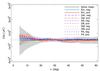
Fig. 21
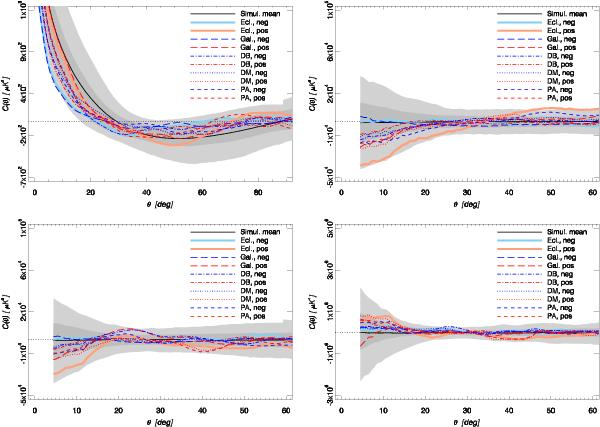
The 2-point (upper left), pseudo-collapsed (upper right), equilateral 3-point (lower left), and rhombic 4-point (lower right) correlation functions for the SMICA map (Nside = 64). Correlation functions are shown for the analysis performed on negative (blue) and positive (red) hemispheres determined in the Ecliptic, Galactic, Doppler boost (DB), dipole modulation (DM), and power asymmetry (PA) coordinate frames. The shaded dark and light grey bands indicate the 68% and 95% confidence regions, respectively. See Sect. 4.3 for the definition of the separation angle θ.
Current usage metrics show cumulative count of Article Views (full-text article views including HTML views, PDF and ePub downloads, according to the available data) and Abstracts Views on Vision4Press platform.
Data correspond to usage on the plateform after 2015. The current usage metrics is available 48-96 hours after online publication and is updated daily on week days.
Initial download of the metrics may take a while.