Fig. 13
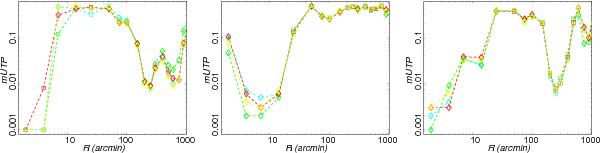
Standard deviation (left), skewness (centre) and kurtosis (right) of the SMHW coefficients as a function of the wavelet scale R. Results are given for the four Planck CMB maps (green, Commander-Ruler; light-blue, NILC; red, SEVEM; and yellow, SMICA). Modified upper tail probabilities (mUTP, see text for details) are obtained by comparing with 1000 simulations processed through the component separation pipelines. Squares represent modified upper tail probabilities that correspond to an actual upper tail probability above 0.5; diamonds represent upper tail probabilities below 0.5.
Current usage metrics show cumulative count of Article Views (full-text article views including HTML views, PDF and ePub downloads, according to the available data) and Abstracts Views on Vision4Press platform.
Data correspond to usage on the plateform after 2015. The current usage metrics is available 48-96 hours after online publication and is updated daily on week days.
Initial download of the metrics may take a while.