Fig. 12
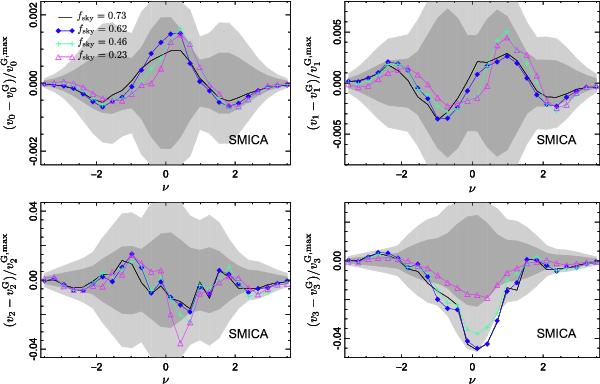
Difference of the normalized MFs obtained from the data with respect to the expected value of the null hypothesis for several sky coverages. The SMICA map is considered. From left to right and top to bottom: area, Contour, Genus and Ncluster. The grey bands represent the 1 and 2σ dispersions around zero, based on realistic Planck simulations including lensing, for fsky = 0.23.
Current usage metrics show cumulative count of Article Views (full-text article views including HTML views, PDF and ePub downloads, according to the available data) and Abstracts Views on Vision4Press platform.
Data correspond to usage on the plateform after 2015. The current usage metrics is available 48-96 hours after online publication and is updated daily on week days.
Initial download of the metrics may take a while.