Free Access
Fig. 10
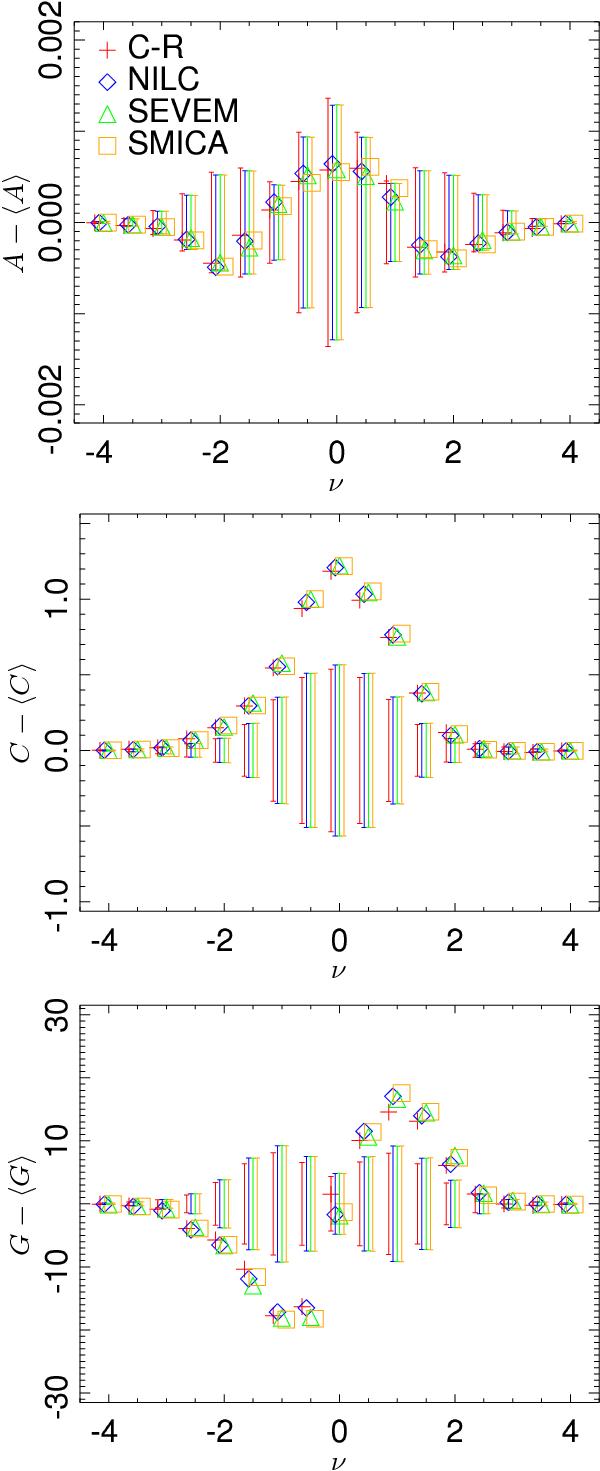
Difference of the data MFs (unnormalized) with respect to the average of the curves obtained with realistic Planck simulations for several cleaned maps. From top to bottom: Area, Contour, Genus. The error-bars represent the ±1σ (68% CL) dispersions around the mean obtained with simulations.
This figure is made of several images, please see below:
Current usage metrics show cumulative count of Article Views (full-text article views including HTML views, PDF and ePub downloads, according to the available data) and Abstracts Views on Vision4Press platform.
Data correspond to usage on the plateform after 2015. The current usage metrics is available 48-96 hours after online publication and is updated daily on week days.
Initial download of the metrics may take a while.