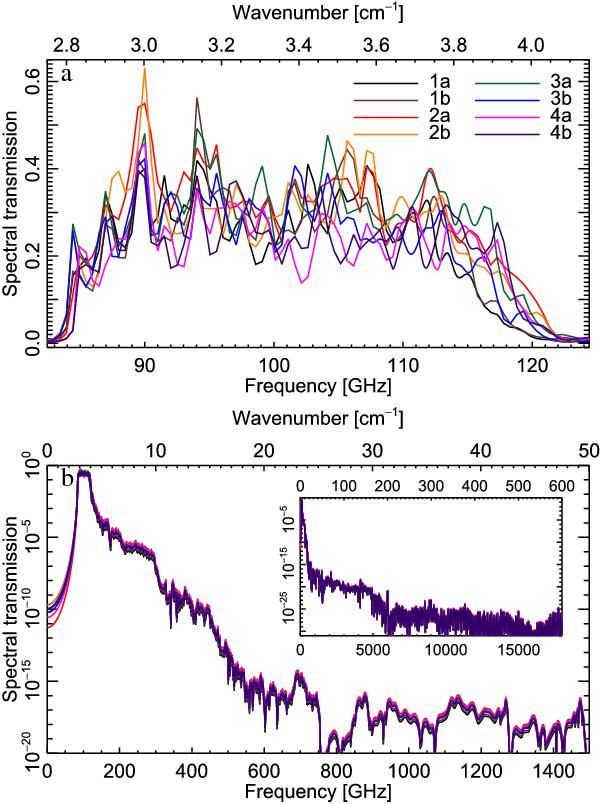
Fig. 5

Detector spectral transmission profiles for the HFI 100 GHz detectors. Plot a) shows the in-band region on a linear vertical scale with plot b) showing a wider spectral region on a logarithmic vertical scale. The inset within plot b) shows the same spectra over the full spectral range available with the same units as the main plot for all axes. The same conventions hold for Figs. 6–10.
Current usage metrics show cumulative count of Article Views (full-text article views including HTML views, PDF and ePub downloads, according to the available data) and Abstracts Views on Vision4Press platform.
Data correspond to usage on the plateform after 2015. The current usage metrics is available 48-96 hours after online publication and is updated daily on week days.
Initial download of the metrics may take a while.


