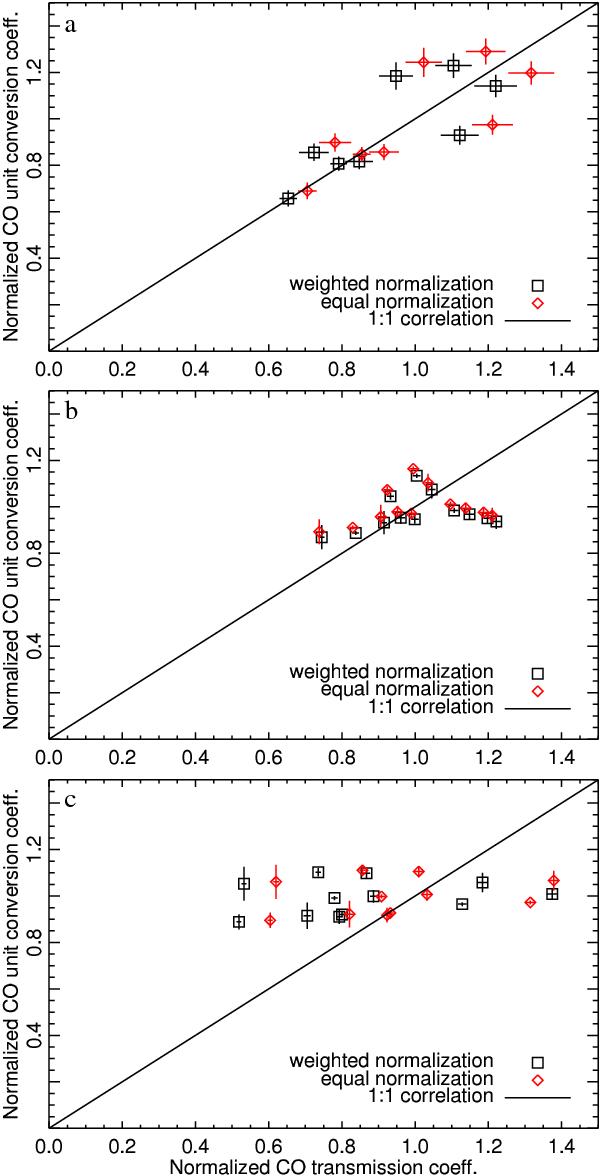
Fig. 19

Comparison of the relative spectral transmission at the CO transition frequency with the relative CO unit conversion coefficient (see Eq. (36)) for the 100 a), 217 b), and 353 c) GHz bands. Each plot shows a uniform normalization (diamonds) where each detector coefficient contributes to the mean equally, a weighted normalization (squares) where the normalization is detector noise weighted, and a reference line to demonstrate deviations of the data points from a perfect one-to-one correlation.
Current usage metrics show cumulative count of Article Views (full-text article views including HTML views, PDF and ePub downloads, according to the available data) and Abstracts Views on Vision4Press platform.
Data correspond to usage on the plateform after 2015. The current usage metrics is available 48-96 hours after online publication and is updated daily on week days.
Initial download of the metrics may take a while.


