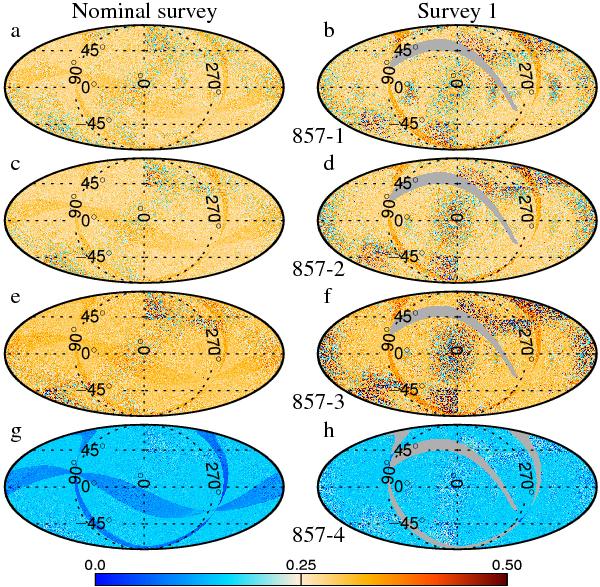
Fig. 11

Detector relative contribution weight factor maps in Galactic coordinates for the 857 GHz detectors, i.e., wm,i as defined in Eq. (6). The left half represent the nominal survey a), c), e), and g), while the right half represent the survey 1 subset of the data (b), d), f), and h)). Data corresponding to detectors 1 through 4 are grouped in rows, i.e., 857-1 is illustrated in a), b), and 857-2,-3, and -4 are found in c), d), e), f), and g), h), respectively. The grey shaded regions indicate where there was no sky coverage.
Current usage metrics show cumulative count of Article Views (full-text article views including HTML views, PDF and ePub downloads, according to the available data) and Abstracts Views on Vision4Press platform.
Data correspond to usage on the plateform after 2015. The current usage metrics is available 48-96 hours after online publication and is updated daily on week days.
Initial download of the metrics may take a while.


