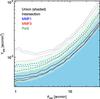
Fig. 9
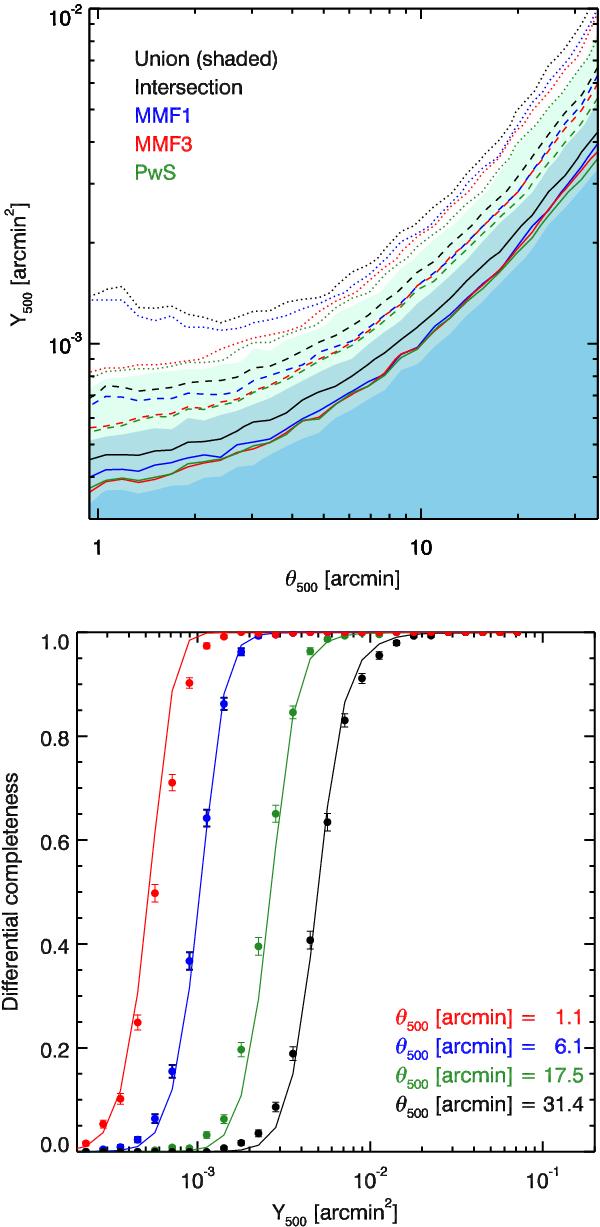
Top panel: differential completeness as a function of (Y500,θ500) for each detection algorithm (MMF1 in blue, MMF3 in red, and PwS in green) and for the union (shaded area) and intersection (black) catalogues. From bottom to top, the solid, dashed, and dotted lines show 15%, 50% and 85% completeness, respectively. Bottom panel: slices through the MCQA-based completeness function at various θ500 for MMF3 compared to the error function approximation (solid curves).
Current usage metrics show cumulative count of Article Views (full-text article views including HTML views, PDF and ePub downloads, according to the available data) and Abstracts Views on Vision4Press platform.
Data correspond to usage on the plateform after 2015. The current usage metrics is available 48-96 hours after online publication and is updated daily on week days.
Initial download of the metrics may take a while.