Fig. 6
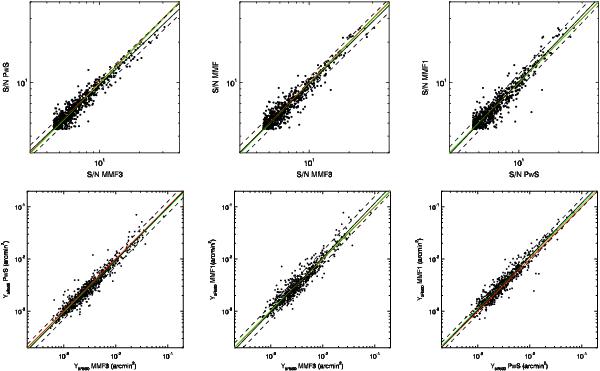
Comparison of S/N (top panels) and maximum likelihood Compton-parameter values (bottom panels) from the three detection algorithms, MMFs and PwS, down to S/N = 4.5 after removing obvious false detections (see Sect. 2.3). In each panel, the red line denotes the equality line. The black line is the best fit to the data, and the dashed lines correspond to the ± 1σ dispersion about the fit relation. For clarity, error bars are omitted on Y5R500 values in the plot, but are taken into account in the fit. The green line of slope fixed to unity corresponds to the mean offset between the two quantities. Numerical results for the fits are given in Table 1.
Current usage metrics show cumulative count of Article Views (full-text article views including HTML views, PDF and ePub downloads, according to the available data) and Abstracts Views on Vision4Press platform.
Data correspond to usage on the plateform after 2015. The current usage metrics is available 48-96 hours after online publication and is updated daily on week days.
Initial download of the metrics may take a while.