Fig. 32
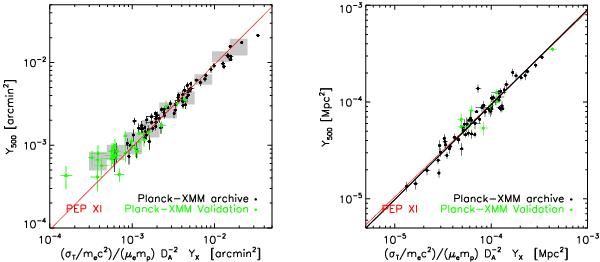
Relation between the Comptonization parameters Y500, and the normalized YX parameter for a sub-sample of the present catalogue. Black points show clusters in the Planck-ESZ sample with XMM-Newton archival data presented by Planck Collaboration XI (2011) and additional LoCuSS clusters studied by Planck Collaboration Int. III (2013). Green points represent new Planck clusters confirmed with XMM-Newton (Planck Collaboration IX 2011; Planck Collaboration Int. I 2012; Planck Collaboration Int. IV 2013). The red line denotes the scaling relations of Planck Collaboration XI (2011). Left panel: relation in units of arcmin2 where Y500 is extracted using the Arnaud et al. (2010) pressure profile. The grey area corresponds to median Y500 values in YX bins with ± σ standard deviation. Right panel: scaling relation between the intrinsic Compton parameter, ![]() , and YX for the sub-sample of S/N> 7 clusters used in the cosmological analysis. The data are corrected for Malmquist bias, and Y500 is extracted using the Planck pressure profile (see text). The black line is the best-fit power-law relation.
, and YX for the sub-sample of S/N> 7 clusters used in the cosmological analysis. The data are corrected for Malmquist bias, and Y500 is extracted using the Planck pressure profile (see text). The black line is the best-fit power-law relation.
Current usage metrics show cumulative count of Article Views (full-text article views including HTML views, PDF and ePub downloads, according to the available data) and Abstracts Views on Vision4Press platform.
Data correspond to usage on the plateform after 2015. The current usage metrics is available 48-96 hours after online publication and is updated daily on week days.
Initial download of the metrics may take a while.