Fig. 29
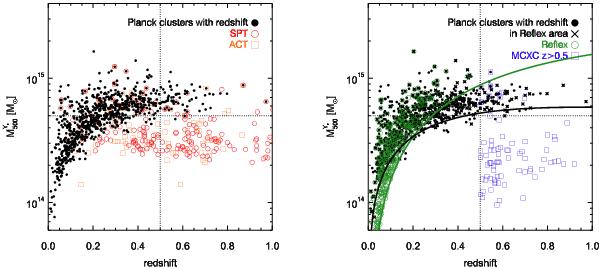
Left panel: distribution in the M–z plane of the Planck clusters (filled circles) compared with the SPT clusters (open light red circles) from Reichardt et al. (2013) and ACT catalogue (open red squares) from Hasselfield et al. (2013). Right panel: distribution in the M–z plane of the Planck clusters (black symbols) as compared to the clusters from the REFLEX catalogue (green open circles) Böhringer et al. (2004). The black crosses indicate the Planck clusters in the REFLEX area. The open blue squares represent clusters from the MCXC catalogue with redshifts above z = 0.5. The green solid line shows the REFLEX detection limit whereas the black solid line shows the Planck mass limit for the medium-deep survey zone at 20% completeness.
Current usage metrics show cumulative count of Article Views (full-text article views including HTML views, PDF and ePub downloads, according to the available data) and Abstracts Views on Vision4Press platform.
Data correspond to usage on the plateform after 2015. The current usage metrics is available 48-96 hours after online publication and is updated daily on week days.
Initial download of the metrics may take a while.