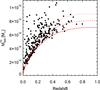
Fig. 28
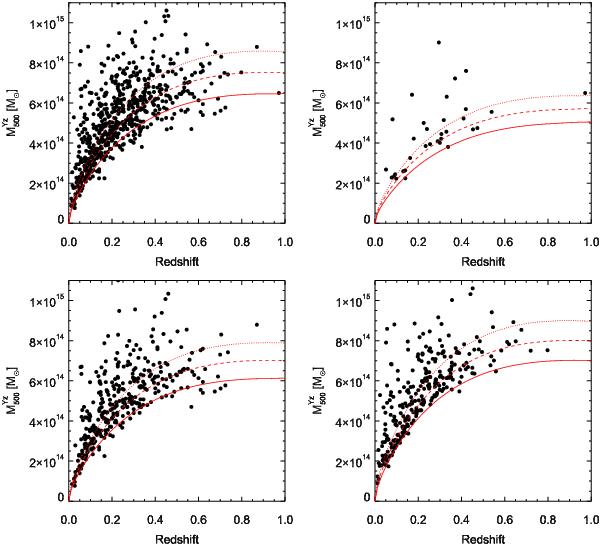
Mass limit illustrated for SZ detections by MMF3 algorithm. Upper left: average mass limit computed from the average noise over the sky. Upper right: same for the deep survey zone corresponding to 2.7% sky coverage centred at the Ecliptic polar regions. Lower left: same for the medium-deep survey area covering 41.3% of the sky. Lower right: same for the shallow-survey area covering 56% of the sky. In each panel, only detections in the corresponding areas are plotted. The lines dotted, dashed and solid lines show the Planck mass limit at 80, 50 and 20% completeness, respectively.
Current usage metrics show cumulative count of Article Views (full-text article views including HTML views, PDF and ePub downloads, according to the available data) and Abstracts Views on Vision4Press platform.
Data correspond to usage on the plateform after 2015. The current usage metrics is available 48-96 hours after online publication and is updated daily on week days.
Initial download of the metrics may take a while.