Fig. 27
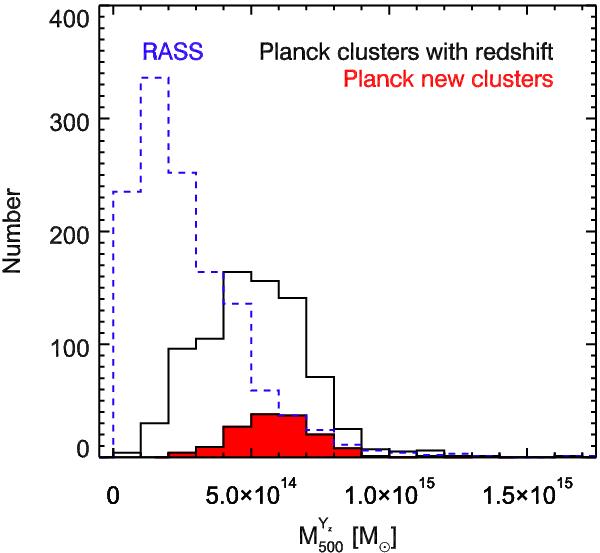
Distribution of masses for the Planck SZ clusters, known or new confirmed clusters (solid black line), compared to the distribution of masses from the RASS-based cluster catalogues (dashed blue line). The masses for the MCXC clusters are estimated from the luminosity-mass relation. The masses for the Planck clusters are computed using the SZ-proxy. The filled red histogram shows the distribution of the newly-discovered Planck clusters.
Current usage metrics show cumulative count of Article Views (full-text article views including HTML views, PDF and ePub downloads, according to the available data) and Abstracts Views on Vision4Press platform.
Data correspond to usage on the plateform after 2015. The current usage metrics is available 48-96 hours after online publication and is updated daily on week days.
Initial download of the metrics may take a while.