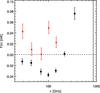
Fig. 25
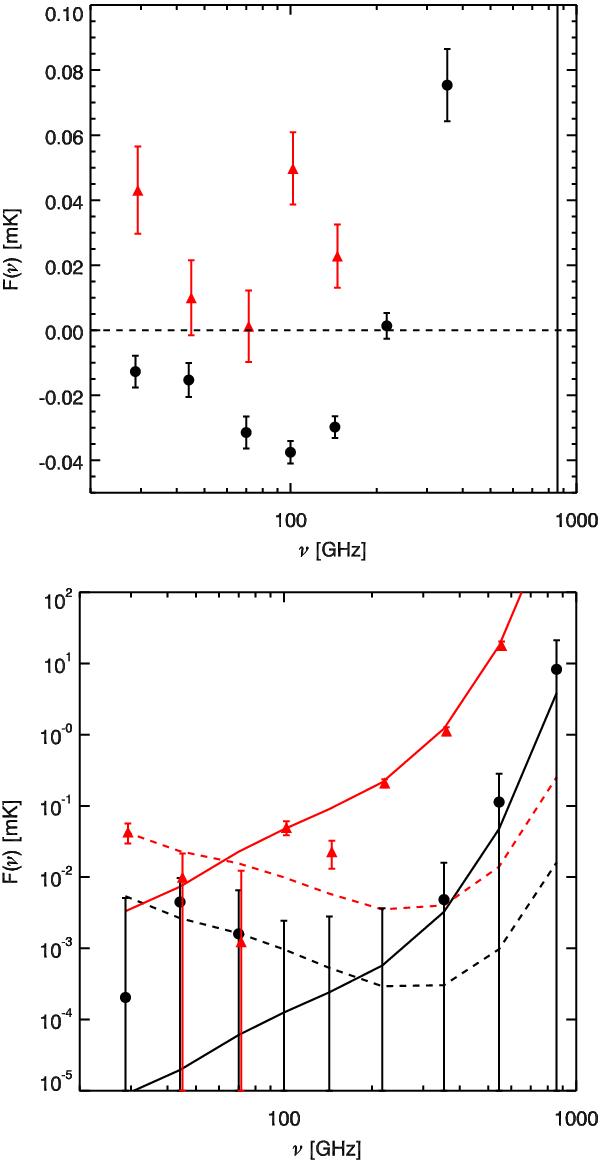
Stacked spectrum for known clusters SZ fluxes across Planck frequency bands. Stacked fluxes are measured in an aperture equal to the FWHM of the 143 GHz channel (i.e., about 7′) for the known clusters (black filled circles) and the low-reliability class3 candidates (red filled triangles). The associated uncertainties correspond to the fluctuation of the background outside the cluster region. The average signal is estimated in each channel before (upper panel) and after (lower panel) the removal of the SZ signal. The average signals expected from IR and radio sources are shown as solid and dashed lines, respectively. Red and black lines are for class3 and bona fide clusters, respectively. No subtraction of an SZ signal is performed for the class3 candidates.
Current usage metrics show cumulative count of Article Views (full-text article views including HTML views, PDF and ePub downloads, according to the available data) and Abstracts Views on Vision4Press platform.
Data correspond to usage on the plateform after 2015. The current usage metrics is available 48-96 hours after online publication and is updated daily on week days.
Initial download of the metrics may take a while.