Fig. 23
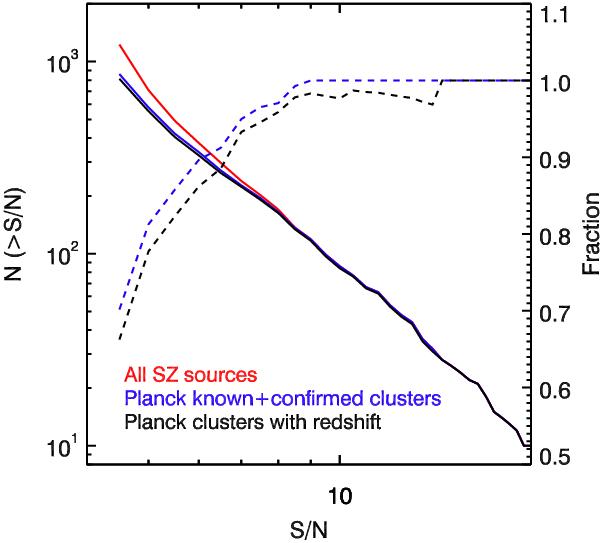
Status of the Planck SZ sources. Left-hand-axis plots show the distribution of all Planck sources (in red). The blue line represents the known or new confirmed clusters and, among these, the clusters with a reported redshift measurement in black. Right-hand-axis cumulative distributions show, as a function of S/N, the fraction of known or new confirmed clusters in blue and those with a redshift in black.
Current usage metrics show cumulative count of Article Views (full-text article views including HTML views, PDF and ePub downloads, according to the available data) and Abstracts Views on Vision4Press platform.
Data correspond to usage on the plateform after 2015. The current usage metrics is available 48-96 hours after online publication and is updated daily on week days.
Initial download of the metrics may take a while.