Fig. 16
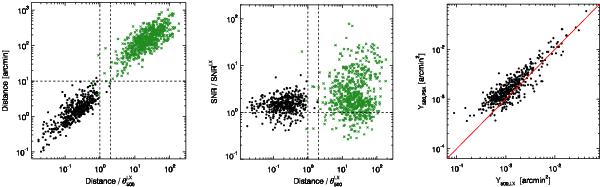
Identification of the Planck cluster candidates with X-ray clusters from the MCXC catalogue. Black points are candidates firmly identified with MCXC clusters, while green points are candidates with no association. Left panel: distance of the Planck position to the position of the closest MCXC cluster as a function of the distance normalized to the cluster size ![]() . Middle panel: S/N normalized to the expected value as a function of normalized distance. Right panel: SZ flux, Y500,PSX, re-extracted fixing the position and size to the X-ray value, as a function of expected values. The red line is the equality line. In all panels,
. Middle panel: S/N normalized to the expected value as a function of normalized distance. Right panel: SZ flux, Y500,PSX, re-extracted fixing the position and size to the X-ray value, as a function of expected values. The red line is the equality line. In all panels, ![]() , and
, and ![]() are estimated from the cluster X-ray luminosity used as mass proxy (see text).
are estimated from the cluster X-ray luminosity used as mass proxy (see text).
Current usage metrics show cumulative count of Article Views (full-text article views including HTML views, PDF and ePub downloads, according to the available data) and Abstracts Views on Vision4Press platform.
Data correspond to usage on the plateform after 2015. The current usage metrics is available 48-96 hours after online publication and is updated daily on week days.
Initial download of the metrics may take a while.