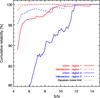
Fig. 11
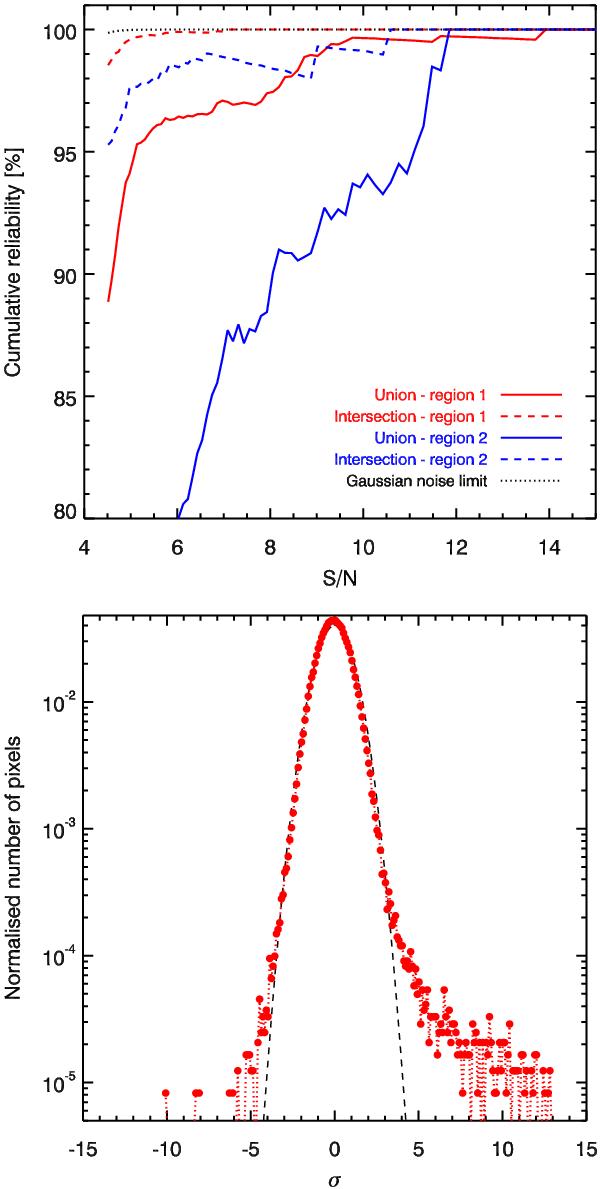
Top panel: cumulative reliability for the union and intersection catalogues, as a function of dust contamination. Region 1 is the low-dust contamination region, being the 65% of the sky outside the Galactic dust mask, and region 2 is the complementary dustier region added to this when the smaller 15% dust mask is applied. The Gaussian noise limit is the expected reliability from purely Gaussian fluctuations. Bottom panel: histogram of the y-signal in a typical filtered patch from a null-test simulation, compared to the best-fit Gaussian (black dashed line). The distribution of y-noise is non-Gaussian.
Current usage metrics show cumulative count of Article Views (full-text article views including HTML views, PDF and ePub downloads, according to the available data) and Abstracts Views on Vision4Press platform.
Data correspond to usage on the plateform after 2015. The current usage metrics is available 48-96 hours after online publication and is updated daily on week days.
Initial download of the metrics may take a while.