Fig. 1
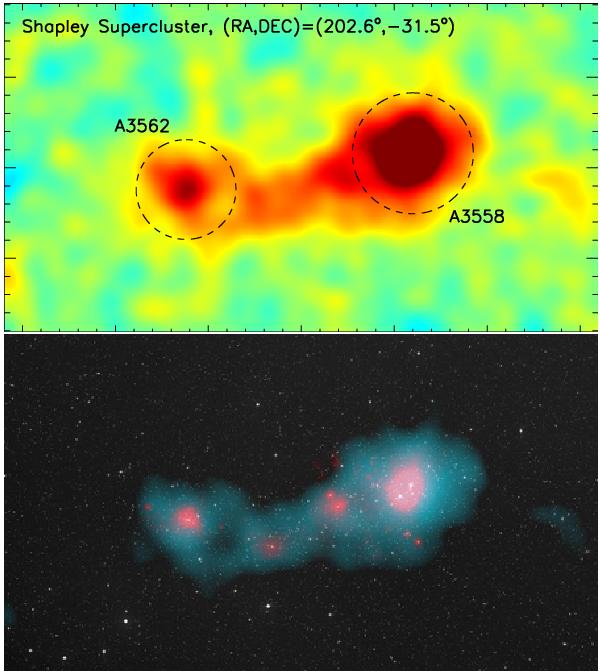
The Shapley super-cluster as seen in the Planck survey. Upper panel: reconstructed thermal SZ map 3.2° × 1.8° from MILCA (Hurier et al. 2013). The dotted circles represent apertures of θ500 from the MCXC meta-catalogue around the resolved clusters. Lower panel: composite view of the optical from DSS images (white), X-rays from ROSAT (pink) survey and of the thermal SZ effect as seen in Planck (blue).
Current usage metrics show cumulative count of Article Views (full-text article views including HTML views, PDF and ePub downloads, according to the available data) and Abstracts Views on Vision4Press platform.
Data correspond to usage on the plateform after 2015. The current usage metrics is available 48-96 hours after online publication and is updated daily on week days.
Initial download of the metrics may take a while.