Fig. 1
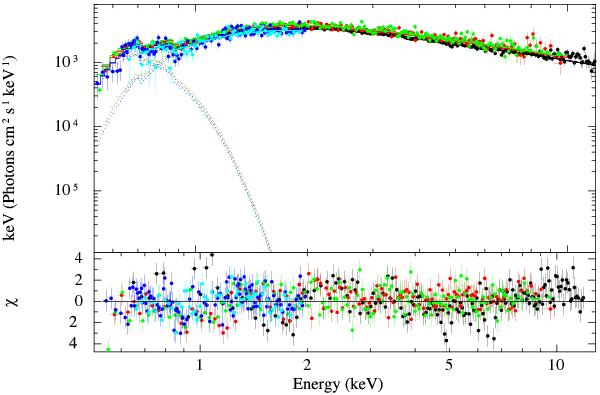
All spectra of J17361 extracted during the XMM-Newton observation. The EPIC-pn spectrum is represented in black, the MOS1 in red, the MOS2 in green, and the combined RGS1 and RGS2 first (second) order spectra in blue (magenta). The best fit is shown, together with the residuals from the fit.
Current usage metrics show cumulative count of Article Views (full-text article views including HTML views, PDF and ePub downloads, according to the available data) and Abstracts Views on Vision4Press platform.
Data correspond to usage on the plateform after 2015. The current usage metrics is available 48-96 hours after online publication and is updated daily on week days.
Initial download of the metrics may take a while.