Fig. 3
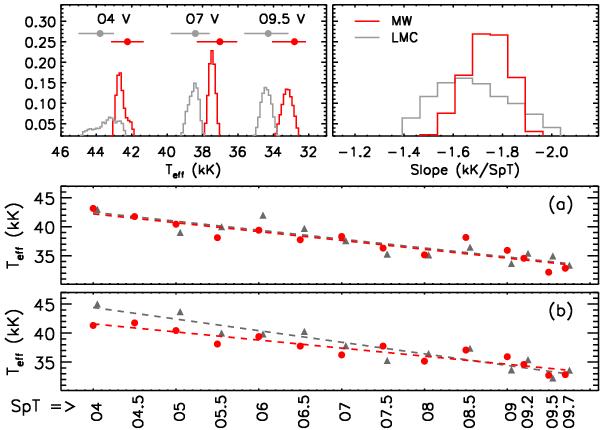
Upper panels: results from a Monte-Carlo simulation where one star is drawn from the Galactic and LMC samples per SpT bin. Probability distributions for the Teff of three representative SpT bins and for the overall slope of the calibration are shown in the left- and right-hand panels. Lower two panels: two possible SpT – Teff relations arising from the simulations (employing the same symbols as in Fig. 1), highlighting the potential consequences of drawing conclusions from small samples.
Current usage metrics show cumulative count of Article Views (full-text article views including HTML views, PDF and ePub downloads, according to the available data) and Abstracts Views on Vision4Press platform.
Data correspond to usage on the plateform after 2015. The current usage metrics is available 48-96 hours after online publication and is updated daily on week days.
Initial download of the metrics may take a while.