Fig. 2
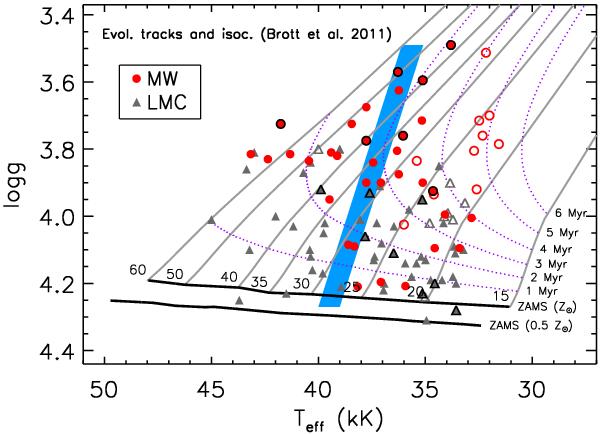
Galactic and LMC O-dwarf results plotted in the Teff–log g diagram (same symbols as Fig. 1). Evolutionary tracks (solid grey lines, with initial masses as indicated at the ZAMS) and isochrones (dotted purple lines) are from Brott et al. (2011) for solar metallicity; the ZAMS for both Z = Z⊙ and 0.5 Z⊙ are indicated as black lines. The blue region indicates where the O7 V stars are located.
Current usage metrics show cumulative count of Article Views (full-text article views including HTML views, PDF and ePub downloads, according to the available data) and Abstracts Views on Vision4Press platform.
Data correspond to usage on the plateform after 2015. The current usage metrics is available 48-96 hours after online publication and is updated daily on week days.
Initial download of the metrics may take a while.