Fig. 2
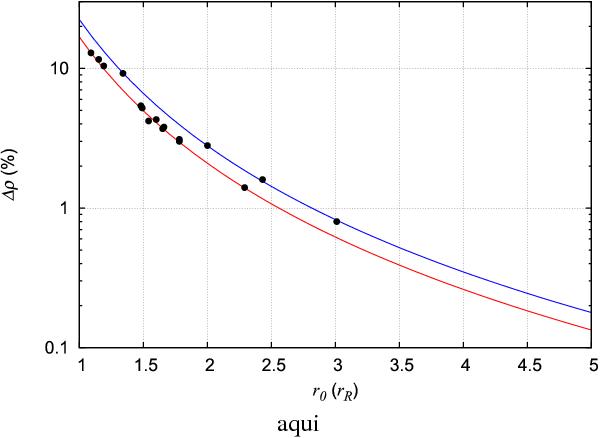
Relative change in the bulk density of close-in planets, Δρ = 1 − ρ/ρs, as a function of the distance to the star r0. The red curve is relative to gaseous planets (hf = 1.5), while the blue one is relative to rocky planets (hf = 2.0). Both curves are obtained using expression (27) with i = 80°. The dots represent the planets listed in Table 1. For r0> 1.5 rR, the change is negligible when compared to the present observational errors in the density determination.
Current usage metrics show cumulative count of Article Views (full-text article views including HTML views, PDF and ePub downloads, according to the available data) and Abstracts Views on Vision4Press platform.
Data correspond to usage on the plateform after 2015. The current usage metrics is available 48-96 hours after online publication and is updated daily on week days.
Initial download of the metrics may take a while.