Free Access
Fig. 6
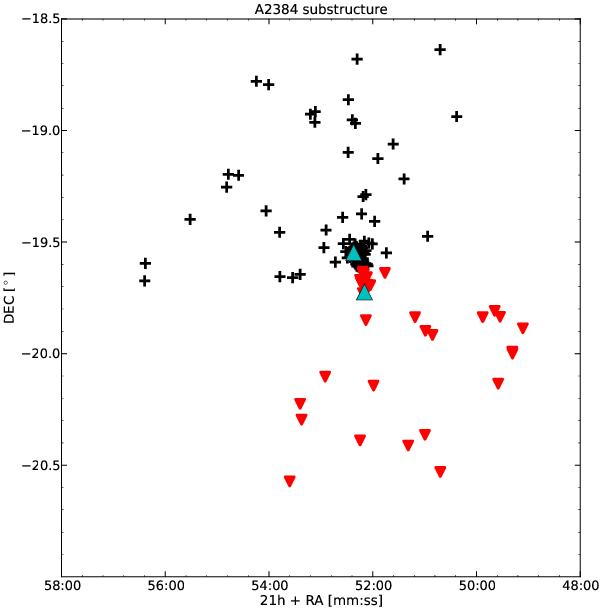
Substructure of A2384. Black crosses represent galaxies in the northern subluster, red triangles indicate objects belonging to the southern subcluster. BCG1 and BCG2 are indicated by cyan triangles.
Current usage metrics show cumulative count of Article Views (full-text article views including HTML views, PDF and ePub downloads, according to the available data) and Abstracts Views on Vision4Press platform.
Data correspond to usage on the plateform after 2015. The current usage metrics is available 48-96 hours after online publication and is updated daily on week days.
Initial download of the metrics may take a while.