Fig. 5
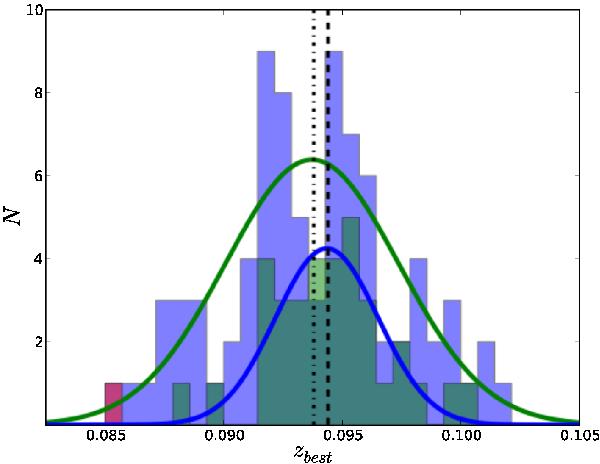
Redshift histogram of the northern cluster sample (NCS, 83 galaxies) in blue and of the southern cluster sample (SCS, 34 galaxies) in green (binsize Δz = 0.0007). The object that gets removed from the SCS after the 3σ clippings is shown in red. The solid lines indicate Gaussian fits to the respective cluster subsample. Note that for the sake of clarity the colours have been interchanged between the histograms and the fits. The dash-dotted and dashed line show the median redshift of the NCS and the SCS, respectively.
Current usage metrics show cumulative count of Article Views (full-text article views including HTML views, PDF and ePub downloads, according to the available data) and Abstracts Views on Vision4Press platform.
Data correspond to usage on the plateform after 2015. The current usage metrics is available 48-96 hours after online publication and is updated daily on week days.
Initial download of the metrics may take a while.