Fig. 3
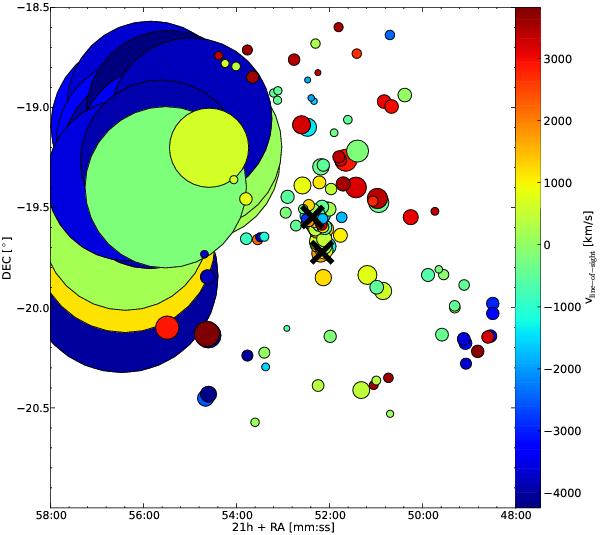
DS-test results for the clustersample of 173 galaxies (after application of ±5000 km s-1 line-of-sight velocity cuts). Their spatial locations are indicated by circles with radii proportional to eδ where δ is the DS-test measure of the local deviation from the global velocity dispersion and mean recessional velocity, i.e. larger symbols correspond to a higher significance of substructure. The colours indicate the rest-frame velocity relative to the systemic cluster line-of-sight velocity in km s-1. The inner cluster regions are identifiable as the overdense central area. The positions of both brightest cluster galaxies (BCG1 and BCG2) are shown by black crosses. The 3D-substructure detected in the eastern region of the cluster consists entirely of galaxies assigned to partition 1 in Fig. 2.
Current usage metrics show cumulative count of Article Views (full-text article views including HTML views, PDF and ePub downloads, according to the available data) and Abstracts Views on Vision4Press platform.
Data correspond to usage on the plateform after 2015. The current usage metrics is available 48-96 hours after online publication and is updated daily on week days.
Initial download of the metrics may take a while.