Fig. 16
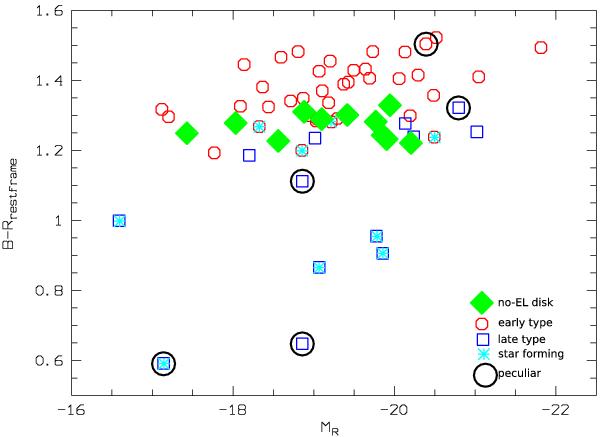
Colour−magnitude diagram of the MCS. Red circles show early type galaxies, blue squares represent late type galaxies and green diamonds illustrate galaxies belonging to the no-EL disk sample (late types). Note that the latter populates the transition region between blue cloud and red sequence. Empty blue squares represent late type galaxies with Hα emission line but without detectable [OII] emission line. Superimposed cyan stars mark late type galaxies with [OII] emission line from which we calculate SFRs according to Kennicutt (1992b). Black circles indicate peculiar objects. The reddest peculiar object is the AGN host and corresponds to galaxy k in the bottom row of Fig. 9.
Current usage metrics show cumulative count of Article Views (full-text article views including HTML views, PDF and ePub downloads, according to the available data) and Abstracts Views on Vision4Press platform.
Data correspond to usage on the plateform after 2015. The current usage metrics is available 48-96 hours after online publication and is updated daily on week days.
Initial download of the metrics may take a while.