Fig. 9
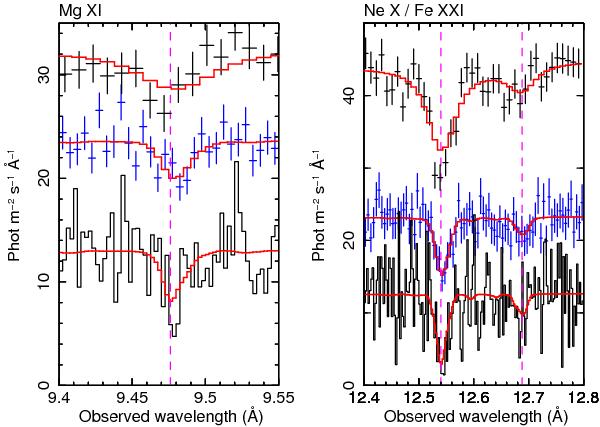
Observed spectra near the strongest Mg xi (left panel) and Ne x (12.54 Å) and Fe xxi (12.69 Å) transitions (right panel). Spectra from top to bottom: RGS, MEG and HEG. For clarity of display we have omitted error bars on the HEG spectra; all spectra have an arbitrary offset in the y-direction, and for better visibility of the weak lines the RGS spectra have in addition been multiplied by a factor of 5 in both panels. The model spectra (thick solid histograms) represent the best-fit HETGS spectrum; for the RGS this model has been simply folded through the RGS data.
Current usage metrics show cumulative count of Article Views (full-text article views including HTML views, PDF and ePub downloads, according to the available data) and Abstracts Views on Vision4Press platform.
Data correspond to usage on the plateform after 2015. The current usage metrics is available 48-96 hours after online publication and is updated daily on week days.
Initial download of the metrics may take a while.