Fig. 8
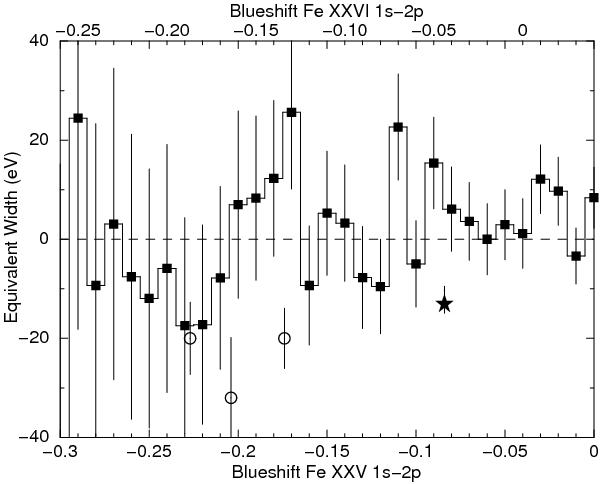
Best-fit equivalent width (EW) of an iron 1s–2p absorption line for the present spectrum taken with the HEG. The lower x-axis corresponds to the blueshift of an Fe xxv line, the upper x-axis to that of an Fe xxvi line. In this plot positive EW corresponds to emission, negative EW to absorption. Filled squares: present HEG data; open circles: the three components reported by Cappi et al. (2009); star: the component discussed by Ponti et al. (2009).
Current usage metrics show cumulative count of Article Views (full-text article views including HTML views, PDF and ePub downloads, according to the available data) and Abstracts Views on Vision4Press platform.
Data correspond to usage on the plateform after 2015. The current usage metrics is available 48-96 hours after online publication and is updated daily on week days.
Initial download of the metrics may take a while.