Fig. 7
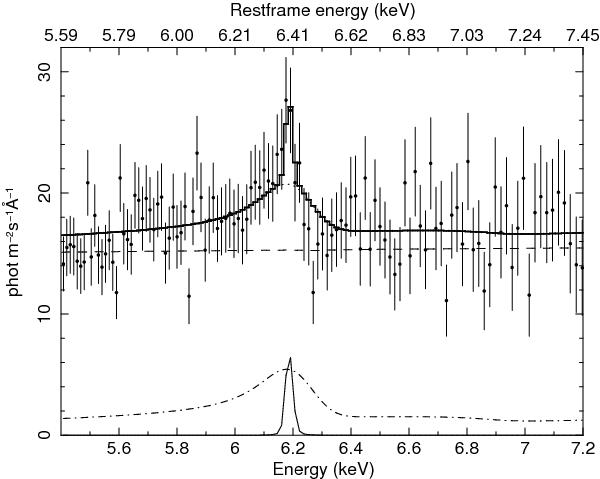
HEG spectrum near the Fe-K emission line (data points with error bars) fitted to a model with a narrow emission line and a relativistically blurred cold reflection component. The lines are from bottom to top: contribution from the narrow emission line (solid), reflection component (dot-dashed), powerlaw component (dashed), sum of power law and reflection (dotted) and total model (solid histogram).
Current usage metrics show cumulative count of Article Views (full-text article views including HTML views, PDF and ePub downloads, according to the available data) and Abstracts Views on Vision4Press platform.
Data correspond to usage on the plateform after 2015. The current usage metrics is available 48-96 hours after online publication and is updated daily on week days.
Initial download of the metrics may take a while.