Fig. 1
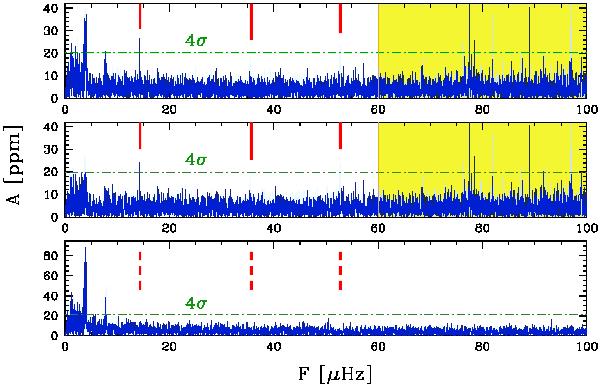
Fourier transform of KIC 10001893 at low frequency. The three panels show the amplitude spectrum using the standard photometry produced by the Kepler pipeline (top), the pixel photometry obtained optimizing the pixels on the target star (center), and the pixel photometry using only 1 pixel, centered on the nearby star (bottom). The plot demonstrates that the frequency at about 4 μHz and its first harmonic are caused by the nearby star, while the three other peaks (marked with tick vertical lines, red in the electronic version) are intrinsic to KIC 10001893. The shaded area at frequency higher than 60 μHz (yellow in the electronic version) represents the region of the g-mode oscillations.
Current usage metrics show cumulative count of Article Views (full-text article views including HTML views, PDF and ePub downloads, according to the available data) and Abstracts Views on Vision4Press platform.
Data correspond to usage on the plateform after 2015. The current usage metrics is available 48-96 hours after online publication and is updated daily on week days.
Initial download of the metrics may take a while.