Free Access
Fig. 7
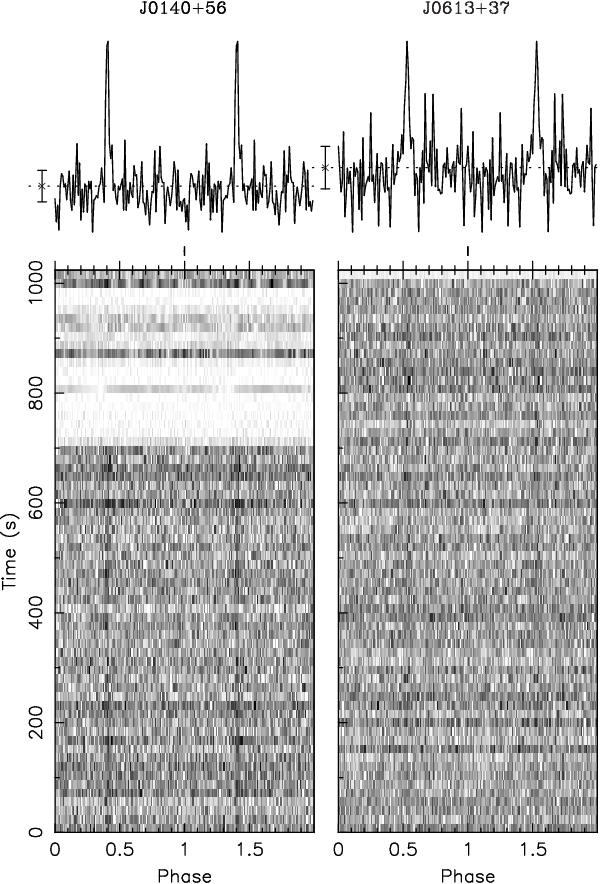
Discovery plots of PSRs J0140+5622 (left) and J0613+3731 (right). Bottom panels: signal strength as a function of time and rotational phase. Some RFI is masked, showing up as whiteouts. Top panels: folded profiles, repeated twice for clarity.
Current usage metrics show cumulative count of Article Views (full-text article views including HTML views, PDF and ePub downloads, according to the available data) and Abstracts Views on Vision4Press platform.
Data correspond to usage on the plateform after 2015. The current usage metrics is available 48-96 hours after online publication and is updated daily on week days.
Initial download of the metrics may take a while.