Fig. 6
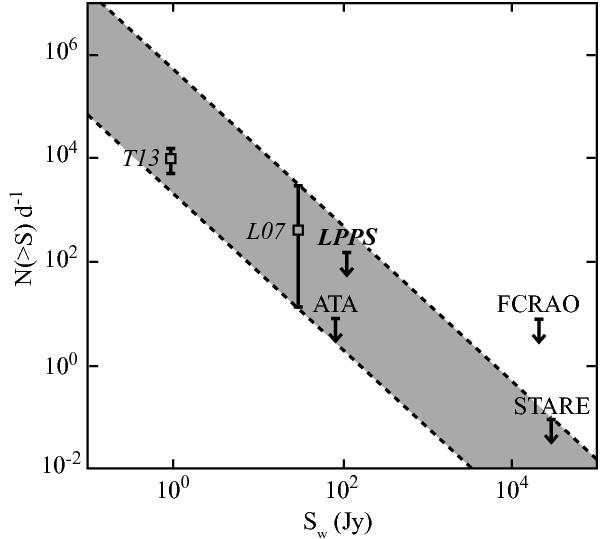
Limits on transient occurrence per day N versus width-adjusted minimum flux  , on a logarithmic scale, comparing previous fast-transient surveys (Kulkarni et al. 2008) with LPPS. The burst rates reported by Lorimer et al. (2007, L07) and Thornton et al. (2013, T13) are plotted with their errors. The area between the dashed lines represents a N( >S) ∝ S− 3 / 2 prediction from a homogeneous, stationary population of objects. The LPPS limit, which assumes a flat spectral index for the purposes of comparing with surveys at other frequencies, is seen near the center.
Current usage metrics show cumulative count of Article Views (full-text article views including HTML views, PDF and ePub downloads, according to the available data) and Abstracts Views on Vision4Press platform.
Data correspond to usage on the plateform after 2015. The current usage metrics is available 48-96 hours after online publication and is updated daily on week days.
Initial download of the metrics may take a while.