Fig. 4
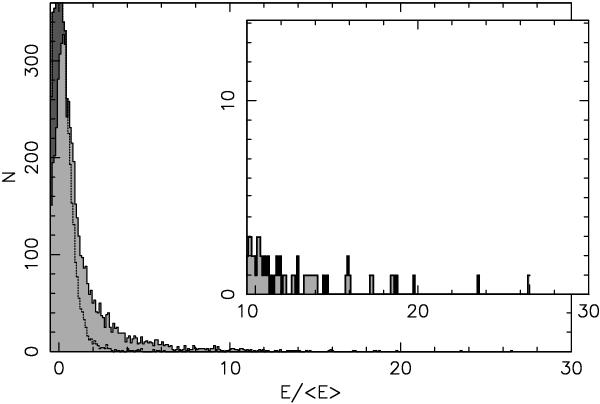
Pulse energy histogram for PSR J0243+6257. Shown are the individual pulse energies for 6000 pulses, compared to their average. The dashed line, filled in dark gray, represents the off-pulse noise distribution. The light gray histogram is the energy present in the on-pulse region. That distribution peaks near zero and has significant overlap with the background histogram. In those pulses no pulsar emission is detected.
Current usage metrics show cumulative count of Article Views (full-text article views including HTML views, PDF and ePub downloads, according to the available data) and Abstracts Views on Vision4Press platform.
Data correspond to usage on the plateform after 2015. The current usage metrics is available 48-96 hours after online publication and is updated daily on week days.
Initial download of the metrics may take a while.