Fig. 3
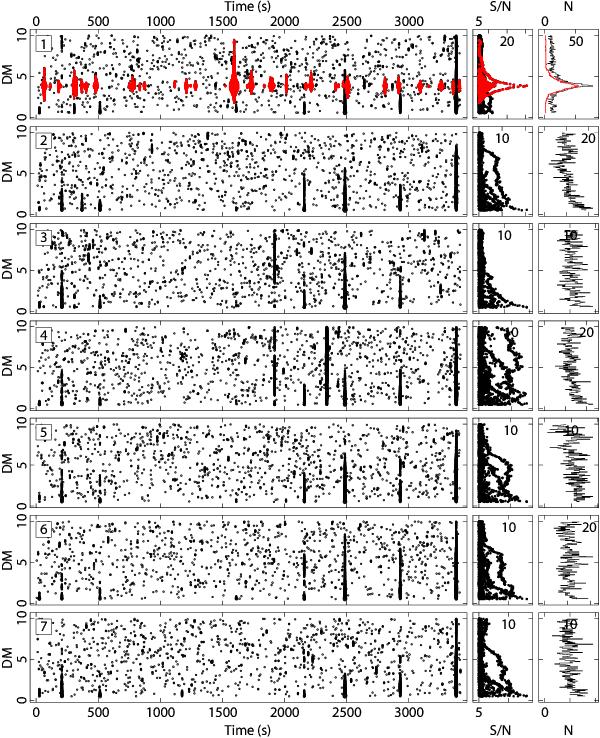
A detection plot of PSR J0243+6257 (Beam 1, top row), as produced by our single-pulse post processing scripts. For each of the seven beams in this observation, the single-pulse detections are plotted between DMs of 0.5 cm-3 pc and 10 cm-3 pc (left panels). The two right-most columns of panels show the events collapsed in time, in DM versus cumulative (S/N) and number of events (N), respectively. The top panel of the plot shows PSR J0243+6257 clearly detected whilst the other beams show no detection, only some RFI. The pulsar is visible in the main top-row DM versus time panel as a series of individual pulses with a DM ~ 3.9 pc cm-3. In post-processing, our automated pulse grouping algorithm (C13) has colored events that are judged to be of an astrophysical origin in red (the black points were automatically judged to be either statistical noise or RFI).
Current usage metrics show cumulative count of Article Views (full-text article views including HTML views, PDF and ePub downloads, according to the available data) and Abstracts Views on Vision4Press platform.
Data correspond to usage on the plateform after 2015. The current usage metrics is available 48-96 hours after online publication and is updated daily on week days.
Initial download of the metrics may take a while.