Fig. 8
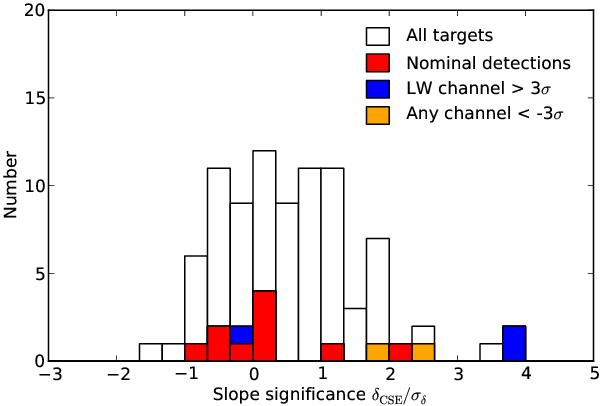
Distribution of the spectral slopes of the flux ratios. The white bars represent the whole sample, red bars represent nominal, broad band detections, blue bars represent targets with excess only in the long wavelength spectral channel, and orange bars represent stars with negative (< − 3σ) excess in one or more channels. White bars can be hidden by colored bars, while colored bars are stacked; i.e., they cannot hide each other. The three targets with significantly positive slopes are HD 172555, HD 182572, and HD 210049. The star with a/σa ~ 0 but with excess only in the long wavelength channel is HD 45184. These cases are discussed in Sect. 4.3.2.
Current usage metrics show cumulative count of Article Views (full-text article views including HTML views, PDF and ePub downloads, according to the available data) and Abstracts Views on Vision4Press platform.
Data correspond to usage on the plateform after 2015. The current usage metrics is available 48-96 hours after online publication and is updated daily on week days.
Initial download of the metrics may take a while.