Free Access
Fig. 7
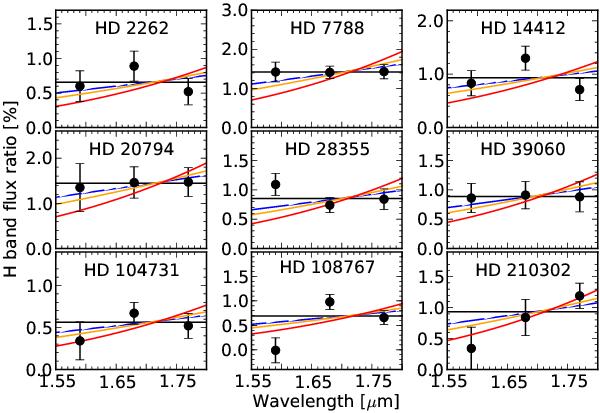
Disk-to-star contrast as a function of wavelength for the detected excess sources. The black line illustrates the case of constant contrast, while the blue, orange, and red lines illustrate the cases of pure black body emission with temperatures of 2000 K, 1500 K, and 1000 K, respectively.
Current usage metrics show cumulative count of Article Views (full-text article views including HTML views, PDF and ePub downloads, according to the available data) and Abstracts Views on Vision4Press platform.
Data correspond to usage on the plateform after 2015. The current usage metrics is available 48-96 hours after online publication and is updated daily on week days.
Initial download of the metrics may take a while.