Fig. 2
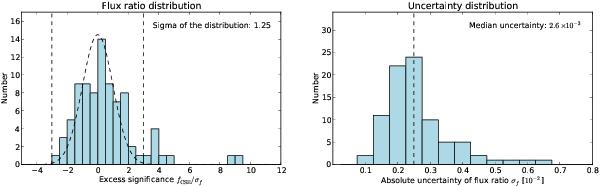
Excess distribution (left) and distribution of uncertainties on the disk-to-star flux ratio (right). The Gaussian overplotted on the excess distribution has a width of σ = 1 and is used to guide the eye and illustrates that the data are consistent with this ideal behavior. Vertical dashed lines are plotted at fCSE/σf = − 3 and fCSE/σf = + 3 for the excess distribution and at the median uncertainty (2.5 × 10⁻³) for the uncertainty distribution.
Current usage metrics show cumulative count of Article Views (full-text article views including HTML views, PDF and ePub downloads, according to the available data) and Abstracts Views on Vision4Press platform.
Data correspond to usage on the plateform after 2015. The current usage metrics is available 48-96 hours after online publication and is updated daily on week days.
Initial download of the metrics may take a while.