Fig. 1
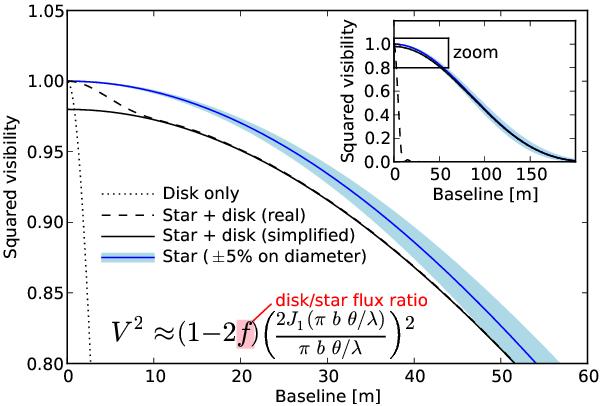
Illustration of our detection strategy following di Folco et al. (2007). For the “real”, dashed curve we assume a uniform disk for both the star and the flux distribution from the exozodiacal dust and a disk-to-star flux ratio of f = 0.01, while for the “simplified”, solid curve we use the same assumptions but the approximation following the equation in the figure. Diameters of the star and (face-on) disk have been chosen to 2.5 mas (about an A-type star at 10 pc) and 500 mas (5 AU at 10 pc), but exact numbers are not relevant for the illustration of our detection strategy. For details see Sect. 3.1.
Current usage metrics show cumulative count of Article Views (full-text article views including HTML views, PDF and ePub downloads, according to the available data) and Abstracts Views on Vision4Press platform.
Data correspond to usage on the plateform after 2015. The current usage metrics is available 48-96 hours after online publication and is updated daily on week days.
Initial download of the metrics may take a while.