Fig. 8
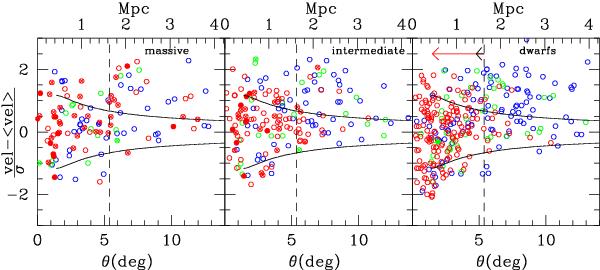
Relationship between  and the angular distance from the cluster centre for massive, intermediate and low-mass galaxies in cluster A and in the field. Red, green, and blue colours are for galaxies in the red sequence, green valley, and blue cloud, respectively. Filled symbols are for slow rotators, crosses for fast rotators. The black dashed vertical line indicates the virial radius of the cluster. The solid lines indicate the caustics that are drown to identify the gravitationally bounded region of cluster A. The black and red horizontal arrows show the mean distance covered by dwarf galaxies within the cluster during the time that they need to become HI-deficient (black) and red (red) after the quenching of their star-formation activity, as predicted by our models.
Current usage metrics show cumulative count of Article Views (full-text article views including HTML views, PDF and ePub downloads, according to the available data) and Abstracts Views on Vision4Press platform.
Data correspond to usage on the plateform after 2015. The current usage metrics is available 48-96 hours after online publication and is updated daily on week days.
Initial download of the metrics may take a while.