Fig. 7
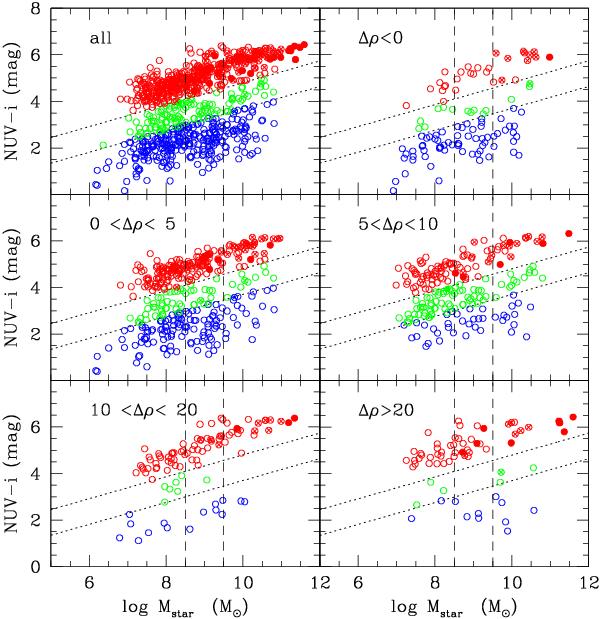
Extinction corrected NUV − i (AB system) vs. Mstar relations for galaxies selected according to their density contrast. Red, green, and blue colours are for galaxies in the red sequence, green valley, and blue cloud, respectively. Filled symbols are for slow rotators; crosses for fast rotators. The vertical dashed lines show the interval in stellar mass used to define massive, intermediate, and low-mass objects within the sample.
Current usage metrics show cumulative count of Article Views (full-text article views including HTML views, PDF and ePub downloads, according to the available data) and Abstracts Views on Vision4Press platform.
Data correspond to usage on the plateform after 2015. The current usage metrics is available 48-96 hours after online publication and is updated daily on week days.
Initial download of the metrics may take a while.