Fig. 6
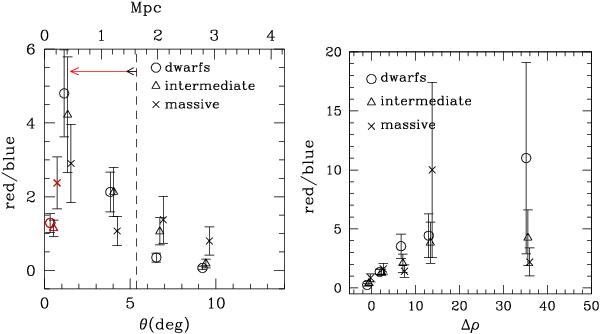
Left: relationship between the red-to-blue galaxy fraction and the angular distance from the cluster centre for massive (crosses), intermediate (triangles) and low-mass (circles) galaxies belonging to cluster A or to the field (black symbols), as measured in bins of half virial radii (crosses and circles are slightly shifted along the X-axis to avoid confusion in the Poisson error estimate). Red symbols give the mean values for the other Virgo cluster substructures (clusters B, C and M, W, W′, and LVC clouds) at their mean angular distance determined in Mpc. The black dashed vertical line indicates the virial radius of cluster A. The black and red horizontal arrows show the mean distance covered by dwarf galaxies within the cluster during the time that they need to become HI-deficient (black) and red (red) after the quenching of their star-formation activity, as predicted by our models. Right: relationship between the red-to-blue galaxy fraction and the density contrast.
Current usage metrics show cumulative count of Article Views (full-text article views including HTML views, PDF and ePub downloads, according to the available data) and Abstracts Views on Vision4Press platform.
Data correspond to usage on the plateform after 2015. The current usage metrics is available 48-96 hours after online publication and is updated daily on week days.
Initial download of the metrics may take a while.