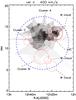
Fig. 4
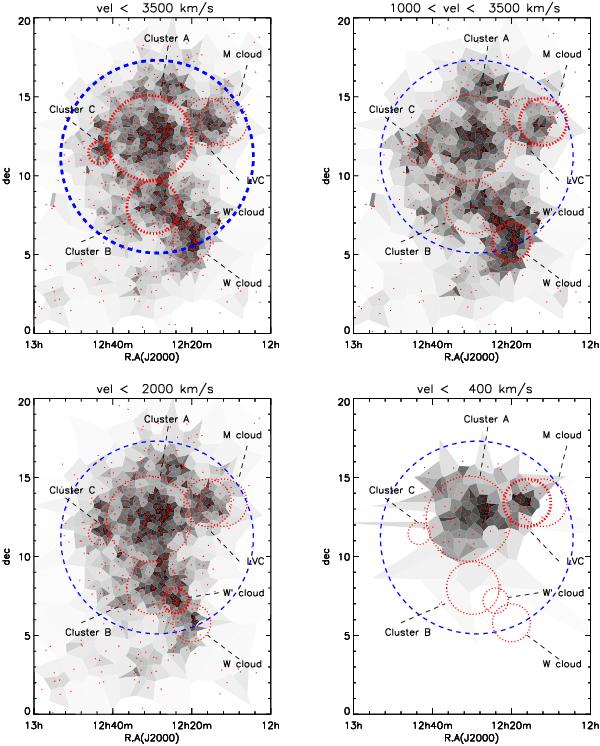
Voronoi tessellation of the Virgo cluster region with darkness increasing according to the local density. The four plots show the Voronoi tessellation done by using the whole sample of galaxies with recessional velocity <3500 km s-1 (upper left), and in three subsamples in the velocity space: 1000 <vel< 3500 km s-1 (upper right), vel< 2000 km s-1 (lower left) and vel< 400 km s-1 (lower right). Red dots indicate the galaxies. The different cluster substructures and the region defining the field are identified with red-dotted and blue-dashed circles. Thicker contours are used whenever the structure has been identified within that velocity range with the only exception of the M cloud (see Table 3).
Current usage metrics show cumulative count of Article Views (full-text article views including HTML views, PDF and ePub downloads, according to the available data) and Abstracts Views on Vision4Press platform.
Data correspond to usage on the plateform after 2015. The current usage metrics is available 48-96 hours after online publication and is updated daily on week days.
Initial download of the metrics may take a while.