Free Access
Fig. 3
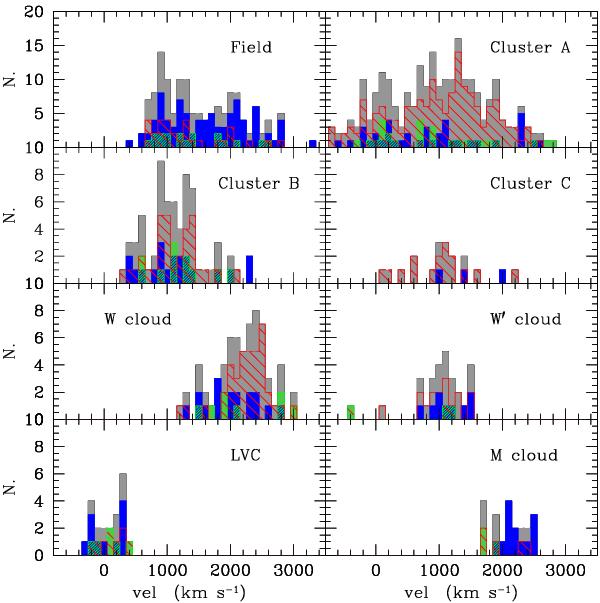
Velocity distribution of galaxies within the different cluster substructures and in the field. The grey histogram shows the distribution of all galaxies; the red, green, and blue histograms are those objects belonging to the red sequence, the green valley, and the blue cloud, respectively.
Current usage metrics show cumulative count of Article Views (full-text article views including HTML views, PDF and ePub downloads, according to the available data) and Abstracts Views on Vision4Press platform.
Data correspond to usage on the plateform after 2015. The current usage metrics is available 48-96 hours after online publication and is updated daily on week days.
Initial download of the metrics may take a while.