Fig. 2
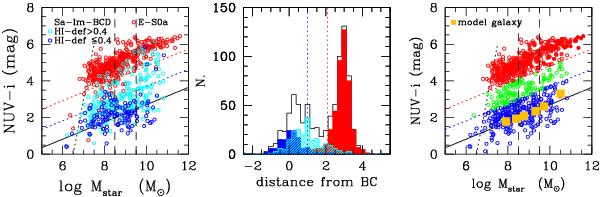
Left: extinction corrected NUV − i (AB system) vs. Mstar relation for all galaxies of the sample. Red symbols are for early-type systems (dE-E-S0a); dark and light blue symbols are for gas normal (HI − def ≤ 0.4) and gas-deficient (HI − def> 0.4) late-type galaxies (Sa-Im-BCD). The solid black line shows the typical NUV − i vs. Mstar relation for model unperturbed late-type galaxies. The black dotted vertical line shows the limit of the GUViCS survey, which is more efficient at detecting blue star-forming systems than red objects. The vertical dashed lines show the interval in stellar mass used to define massive, intermediate, and low-mass objects within the sample. The red and blue dotted lines indicate the limit used to define the red sequence and the blue cloud. Centre: distribution of the colour difference (NUV − i) − (NUV − i)Mod (distance from the blue cloud BC) for the whole sample (black), for early-type galaxies (red), and for HI-normal (HI − def ≤ 0.4; dark blue) and gas-deficient (HI − def> 0.4; light blue) late-type galaxies. The vertical red and blue dotted lines indicate the limits used to identify the red sequence and the blue cloud. Right: NUV − i vs. Mstar relation where galaxies are coded according to their belonging to the red sequence (red), green valley (green), and blue cloud (blue). The unpeturbed model galaxies are indicated by orange filled squares. Lines are as in the left panel.
Current usage metrics show cumulative count of Article Views (full-text article views including HTML views, PDF and ePub downloads, according to the available data) and Abstracts Views on Vision4Press platform.
Data correspond to usage on the plateform after 2015. The current usage metrics is available 48-96 hours after online publication and is updated daily on week days.
Initial download of the metrics may take a while.