Fig. A.1
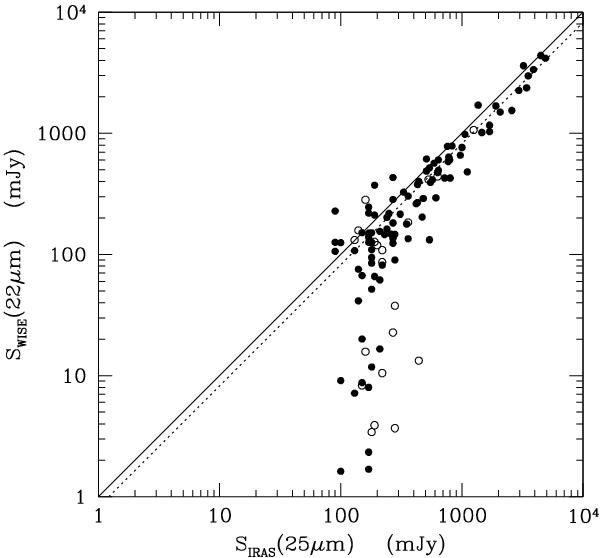
Comparison of the 22 μm WISE flux densities determined in this work with those measured at 25 μm by IRAS for 119 detected galaxies in common. The solid line shows the 1:1 relation, while the dotted line is the expected relation once the WISE data are corrected by a factor of 1.22, as indicated by Ciesla et al. (2014) to take the shift in the photometric bands into account. Filled dots indicates late-type galaxies, empty-symbols early-types.
Current usage metrics show cumulative count of Article Views (full-text article views including HTML views, PDF and ePub downloads, according to the available data) and Abstracts Views on Vision4Press platform.
Data correspond to usage on the plateform after 2015. The current usage metrics is available 48-96 hours after online publication and is updated daily on week days.
Initial download of the metrics may take a while.