Fig. 14
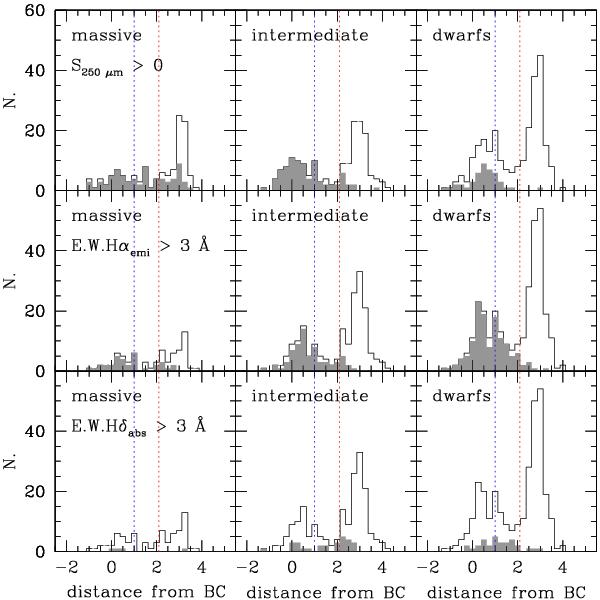
Distribution of the colour difference (NUV − i) − (NUV − i)Mod corresponding to the mean distance from typical colour-stellar mass relation of blue cloud (BC) objects for massive (Mstar> 109.5M⊙; left), intermediate (108.5<Mstar ≤ 109.5M⊙; centre), and dwarf (Mstar ≤ 108.5M⊙; right) galaxies. The upper row shows the distribution of galaxies observed (black histogram) and detected (grey shaded histogram) by Herschel; the middle and lower rows are the distributions of objects with available nuclear spectroscopy from SDSS (black) with a nuclear star-formation activity (grey) or in a post-starburst phase (grey), respectively. The vertical red and blue dotted lines indicate the limits used to identify the red sequence and the blue cloud.
Current usage metrics show cumulative count of Article Views (full-text article views including HTML views, PDF and ePub downloads, according to the available data) and Abstracts Views on Vision4Press platform.
Data correspond to usage on the plateform after 2015. The current usage metrics is available 48-96 hours after online publication and is updated daily on week days.
Initial download of the metrics may take a while.