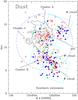
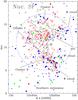
Fig. 13
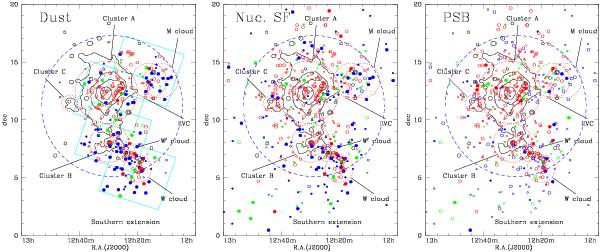
Left: sky distribution of the subsample of galaxies observed by Herschel. Red, green, and blue symbols are used to indicate galaxies belonging to the red sequence, green valley, and blue cloud, respectively. Filled dots indicate dust-rich galaxies, while empty symbols are undetected objects. The size of the symbols is proportional to the stellar mass of galaxies: medium size symbols are for objects with 108.5<Mstar ≤ 109.5M⊙, small size symbols for 108 ≤ Mstar ≤ 108.5M⊙. Centre: sky distribution of the subsample of galaxies observed in spectroscopic mode by the SDSS. Filled dots indicate galaxies with an equivalent width in the Hα emission line EW Hαemi> 3 Å (and S/N> 5), witnessing a nuclear star-forming activity. Right: same as central plot but where filled dots indicate PSB galaxies. In these last two plots, medium size symbols are for objects with 108.5<Mstar ≤ 109.5M⊙; small size symbols are for Mstar ≤ 108.5M⊙.
Current usage metrics show cumulative count of Article Views (full-text article views including HTML views, PDF and ePub downloads, according to the available data) and Abstracts Views on Vision4Press platform.
Data correspond to usage on the plateform after 2015. The current usage metrics is available 48-96 hours after online publication and is updated daily on week days.
Initial download of the metrics may take a while.