Fig. 10
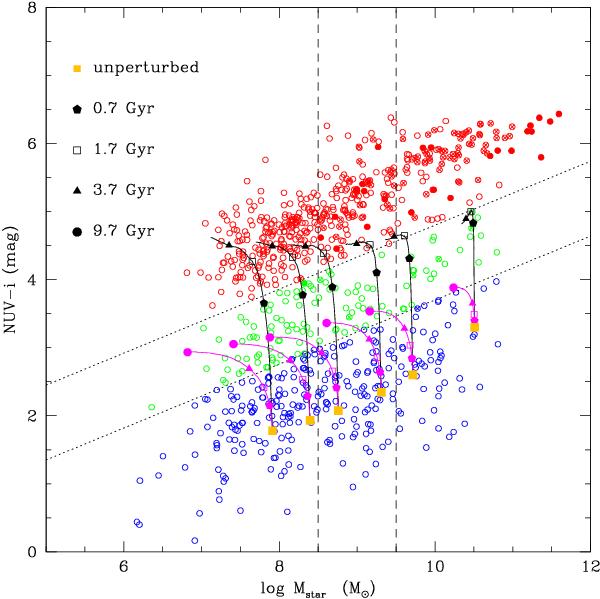
Extinction corrected NUV − i (AB system) vs. Mstar relation for all galaxies of the sample. Filled symbols are for slow rotators; crosses are for fast rotators. Symbols are colour coded as in Fig. 2. The large orange filled squares indicate the models of unperturbed galaxies of spin parameter λ = 0.05 and rotational velocity 40, 55, 70, 100, 130, 170, and 220 km s-1. The magenta lines indicate the starvation models. The black lines show the ram pressure stripping models. Different symbols along the models indicate the position of the model galaxies at a given look-back time from the beginning of the interaction.
Current usage metrics show cumulative count of Article Views (full-text article views including HTML views, PDF and ePub downloads, according to the available data) and Abstracts Views on Vision4Press platform.
Data correspond to usage on the plateform after 2015. The current usage metrics is available 48-96 hours after online publication and is updated daily on week days.
Initial download of the metrics may take a while.