Fig. 4
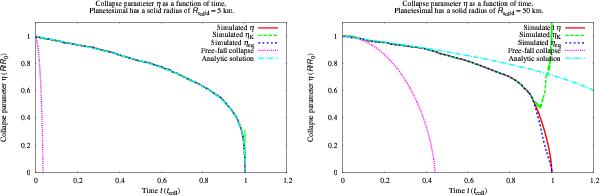
Total energy, parametrized through η ≡ R(t) /R0, as a function of time for two clouds with, initially, cm-sized pebbles. Left panel: collapse of a cloud with Rsolid = 5 km; right panel: cloud with Rsolid = 50 km. The red lines show the actual size of the cloud, blue lines the equilibrium values (ηeq ≡ E0/E), and green lines the kinetic energy (ηK ≡ T0/T). The pink line shows the free-fall collapse of a cloud and the teal lines the analytic solution from Appendix A. We note that time is measured in units of the collapse time. Therefore the free-fall line is different for the two clouds. In the case of the low-mass cloud the collapse is slow and the only outcome of collisions is bouncing. Therefore it is in virial equilibrium until the very end of the collapse and follows the analytical solution (η = ηK = ηeq). The massive cloud, on the other hand, has initially higher collision speeds which lead to pebble fragmentation and rapid energy dissipation. At about η = 0.5 the energy dissipation becomes faster than free-fall, so the cloud does not get into virial equilibrium before the next pebble collision (the first term in Eq. (7)dominates over the second). This results in a transition to cold collapse (η is parallel to the free-fall curve) with subvirial speeds (ηK>ηeq).
Current usage metrics show cumulative count of Article Views (full-text article views including HTML views, PDF and ePub downloads, according to the available data) and Abstracts Views on Vision4Press platform.
Data correspond to usage on the plateform after 2015. The current usage metrics is available 48-96 hours after online publication and is updated daily on week days.
Initial download of the metrics may take a while.