Free Access
Table 1
DustEM parameters of the Jones et al. (2013) dust model.
| Composition | Size | Eg ( eV ) | ρ (g cm-3 ) | α | amin/amax | ac, at/a0 | γ/σ | Y | f M − tot |
| core/mantle | distribution | core/mantle | core/mantle | (nm) | (nm) | (M/MH) | |||
|
|
|||||||||
| a-C:H/a-C | power-law | 2.5/0.1 | 1.3/1.6 | 5.0 | 0.4/4900 | 50, 10/− | 1.0/− | 1.6 × 10⁻³ | 18.6% |
| a-C:H/a-C | log-normal | 2.5/0.1 | 1.3/1.6 | − | 0.5/4900 | −, −/7.0 | −/1.0 | 0.6 × 10⁻³ | 7.0% |
| a-SilFe/a-C | log-normal | ~ 8/0.1 | 2.5/1.6 | − | 1.0/4900 | −, −/8.0 | −/1.0 | 5.8 × 10⁻³ | 67.4% |
| −/a-C | mantle | −/0.1 | −/1.6 | − | d = 5 nm | −, −/− | −/− | 0.6 × 10⁻³ | 7.0% |
|
|
|||||||||
| Total | 8.6 × 10⁻³ | ||||||||
Notes. Eg and ρ are the band gap and the density of the material. The power-law distribution is defined as dn/ da ∝ aα and an exponential decay is applied by multiplying it by exp(−[(a − at) /ac] γ) for a>at, while the log-normal distribution is defined as 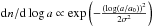 .
.
Current usage metrics show cumulative count of Article Views (full-text article views including HTML views, PDF and ePub downloads, according to the available data) and Abstracts Views on Vision4Press platform.
Data correspond to usage on the plateform after 2015. The current usage metrics is available 48-96 hours after online publication and is updated daily on week days.
Initial download of the metrics may take a while.